

Mastering Linear Regression: A Mathematical Journey to Predictive Excellence


Table of contents
- INTRODUCTION
- GOAL
- ASSUMPTION
- TYPES OF LINEAR REGRESSION
- SIMPLE LINEAR REGRESSION
- SIMPLE LINEAR REGRESSION EQUATION
- EXAMPLE FOR SIMPLE LINEAR REGRESSION
- MULTIPLE LINEAR REGRESSION
- MULTIPLE LINEAR REGRESSION EQUATION
- EXAMPLE FOR MULTIPLE LINEAR REGRESSION
- CODE FOR SIMPLE LINEAR REGRESSION
- CODE FOR MULTIPLE LINEAR REGRESSION
- USE OF LINEAR REGRESSION
- CONCLUSION
INTRODUCTION
Linear regression is a powerful statistical technique used to model the relationship between a dependent variable and one or more independent variables. It is widely employed in various fields, including finance, economics, social sciences, and machine learning.
GOAL
To find a linear equation that best fits the given data
Allowing us to make predictions and understand the relationship between the variables.
ASSUMPTION
It assumes a linear relationship between the independent variables and the dependent variable.
It is represented by a straight line on a scatter plot.
TYPES OF LINEAR REGRESSION
SIMPLE LINEAR REGRESSION
MULTIPLE LINEAR REGRESSION
SIMPLE LINEAR REGRESSION
Simple linear regression involves a single independent variable (predictor variable) and a single dependent variable. It models the linear relationship between the predictor variable and the response variable.
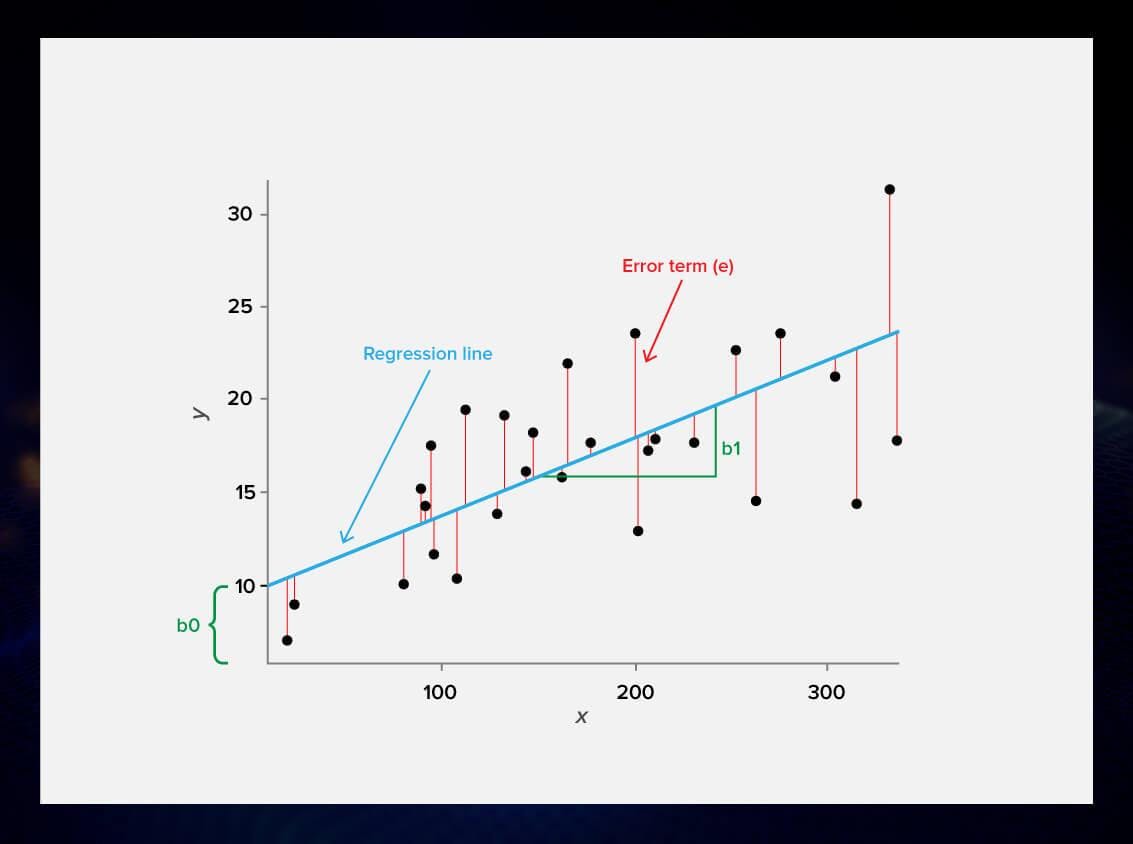
SIMPLE LINEAR REGRESSION EQUATION
$$y = b1x + b0$$
where,
y: Dependent variable
x: Independent variable
b1: Coefficient(slope)
b0: y-intercept
TO FIND THE SLOPE :
$$b1=(nΣxy - ΣxΣy) / (nΣx^2 - (Σx)^2)$$
TO FIND THE INTERCEPT :
$$b0=(Σy - b1Σx) / n$$
NOTE: n- number of data points in the record.
EXAMPLE FOR SIMPLE LINEAR REGRESSION
Given dataset
| X | 6 | 7 | 8 | 9 | 10 |
| Y | 1 | 8 | 20 | 23 | 25 |
Find the regression line for dependent variable y using this data.
SOLUTION:
w.k.t
$$Y = b1X + b0$$
| X | Y | XY | X^2 |
| 1 | 1.5 | 1.5 | 1 |
| 2 | 3.8 | 7.6 | 4 |
| 3 | 6.7 | 20.1 | 9 |
| 4 | 9.0 | 36 | 16 |
| 5 | 11.2 | 56 | 25 |
| 6 | 13.6 | 81.6 | 36 |
| 7 | 16 | 112 | 49 |
| ΣX=28 | ΣY=61.8 | ΣXY=314.8 | ΣX^2=140 |
Applying,
THE SLOPE:
$$b1=(nΣXY - ΣXΣY) / (nΣX^2 - (ΣY)^2)$$
$$ b1=((7314.8)-(2861.8))/(7*140-(28)^2)$$
$$ b1=473.7/196=2.4142857$$
THE INTERCEPT:
$$b0=(ΣY - b1ΣX) / n$$
$$ b0=(61.8-(2.4142857*28))/7$$
$$ b0=-0.828571$$
FINAL REGRESSION EQUATION:
$$Y=2.41X-0.83$$
MULTIPLE LINEAR REGRESSION
Multiple linear regression involves two or more independent variables and a single dependent variable. It extends the concept of simple linear regression to model the linear relationship between multiple predictors and the response variable simultaneously.
MULTIPLE LINEAR REGRESSION EQUATION
$$y = b0 + b1x1 + b2x2 + ... + bnxn$$
where,
y: Dependent variable
x1,x2......xn: Independent variables
b1,b2........bn: Coefficients(slopes)
b0: y-intercept
TO FIND THE COEFFICIENT:
We go with the Matrix-Inversion method.
$$b'=((x^Tx)'x^T)y$$
here,
x-Independent variable matrix with 1s at the first column
y-Dependent variable matrix
b'=coefficients i.e b0,b1,b2...bn
EXAMPLE FOR MULTIPLE LINEAR REGRESSION
Given data,
| Product-1 sales | Product-2 sales | Weekly sales |
| 1 | 4 | 1 |
| 2 | 5 | 6 |
| 3 | 8 | 8 |
| 4 | 2 | 12 |
Find the regression equation for weekly sales which is the dependent variable and Product-1 & Product-2 are independent variables.
SOLUTION:
The regression equation for this case is
$$y=b0+b1x1+b2x2$$
Step1 :
INDEPENDENT MATRIX (x):
| 1 | 1 | 4 |
| 1 | 2 | 5 |
| 1 | 3 | 8 |
| 1 | 4 | 2 |
Step2 :
DEPENDENT MATRIX (y):
| 1 |
| 6 |
| 8 |
| 12 |
Step3 :
TRANSPOSE OF x i.e x^T:
| 1 | 1 | 1 | 1 |
| 1 | 2 | 3 | 4 |
| 4 | 5 | 8 | 2 |
Step4 :
FIND (x^T)x:
| 4 | 10 | 19 |
| 10 | 30 | 46 |
| 19 | 46 | 109 |
Step5 :
FIND INVERSE ((x^T)x)':
| 3.15 | -0.59 | -0.30 |
| -0.59 | 0.20 | 0.016 |
| -0.30 | 0.016 | 0.054 |
Step6 :
FIND ((x^T)x)'x^T:
| 0.05 | 0.47 | -1.02 | 0.19 |
| -0.32 | -0.098 | 0.155 | 0.26 |
| -0.065 | 0.005 | 0.185 | -0.125 |
Step7 :
Equating the above result with b'
here b' is
| b0 |
| b1 |
| b2 |
we get
b0=-1.69
b1=3.48
b2=-0.05
Step8 :
Substituting the b0,b1,b2 in regression equation we get
$$y=-1.69+3.48x1-0.05x2$$
CODE FOR SIMPLE LINEAR REGRESSION
import numpy as np
from sklearn.linear_model import LinearRegression

# Example dataset
X = np.array([1, 2, 3, 4, 5]).reshape(-1, 1)  # Independent variable (reshape to a column vector)
y = np.array([2, 4, 6, 8, 10])                # Dependent variable

# Create and fit the linear regression model
model = LinearRegression()
model.fit(X, y)

# Get the slope (coefficient) and intercept of the regression line
slope = model.coef_[0]
intercept = model.intercept_

# Print the results
print("Slope (Coefficient):", slope)
print("Intercept:", intercept)
OUTPUT:
Slope (Coefficient): 2.0000000000000004
Intercept: -1.7763568394002505e-15
CODE FOR MULTIPLE LINEAR REGRESSION
import numpy as np
from sklearn.linear_model import LinearRegression

# Example dataset
X = np.array([[1, 2], [2, 5], [3, 9], [4, 3], [5, 6]])  # Independent variables (features)
y = np.array([3, 5, 7, 9, 11])                          # Dependent variable

# Create and fit the multiple linear regression model
model = LinearRegression()
model.fit(X, y)

# Get the coefficients (slopes) and intercept of the regression line
coefficients = model.coef_
intercept = model.intercept_

# Print the results
print("Coefficients:", coefficients)
print("Intercept:", intercept)
CODE:
Coefficients: [2.0000000e+00 1.7286149e-16]
Intercept: 0.9999999999999991
NOTE:
Reshaping the independent data in Multiple linear regression is not necessary
Linear Regression model supports both Simple and Multiple linear regression.
USE OF LINEAR REGRESSION
| Situation | Use of Linear Regression |
| Analyzing the relationship between two variables | Simple Linear Regression |
| Predicting a numerical outcome based on a single predictor variable | Simple Linear Regression |
| Examining the impact of multiple predictor variables on a dependent variable | Multiple Linear Regression |
| Forecasting future trends or outcomes | Simple or Multiple Linear Regression |
| Making predictions in machine learning | Simple or Multiple Linear Regression |
| Identifying the strength and direction of the relationship between variables | Simple Linear Regression (with correlation coefficient calculation) |
CONCLUSION
Linear regression provides a powerful framework for analyzing and modeling the relationships between variables. Its mathematical calculations, types, and applications make it an indispensable tool for data analysis and prediction. By mastering linear regression techniques, we unlock the ability to uncover patterns, make informed predictions, and gain deeper insights into the underlying dynamics of the data.
Hope you enjoyed the reading !!!
Let's see you on the next blog !!!
Stay tuned !!!
Follow the blog !!!
Thank you!!!