Revolutionizing Diabetic Retinopathy Diagnosis: The Power of AI in Medical Imaging


Table of contents
- Introduction
- Diabetic Retinopathy
- Stages in diabetic retinopathy
- Challenges in manual diagnosis and database visualization in diabetic retinopathy (DR)
- Our AI-based medical imaging system overcomes challenges in DR diagnosis
- Building an Effective Diabetic Retinopathy Prediction Model using ResNet
- Building a responsive system using Streamlit
- Diabetic Retinopathy Application Result Images
- UNIQUENESS OF OUR APPLICATION
- CONCLUSION
Introduction
The manual diagnosis system in medical imaging has several drawbacks, including subjectivity, limited availability, and time-consuming processes. To address these challenges, our AI-based solution for retinopathy diagnosis offers a web application that utilizes image processing and machine learning. With high diagnostic accuracy, AI predictions, and streamlined processes, our solution overcomes the limitations of the existing system. In this blog post, we will explore the capabilities of our AI-powered retinopathy diagnosis application and its potential to revolutionize medical diagnostics, providing objective results and improved accessibility for healthcare professionals and patients alike.
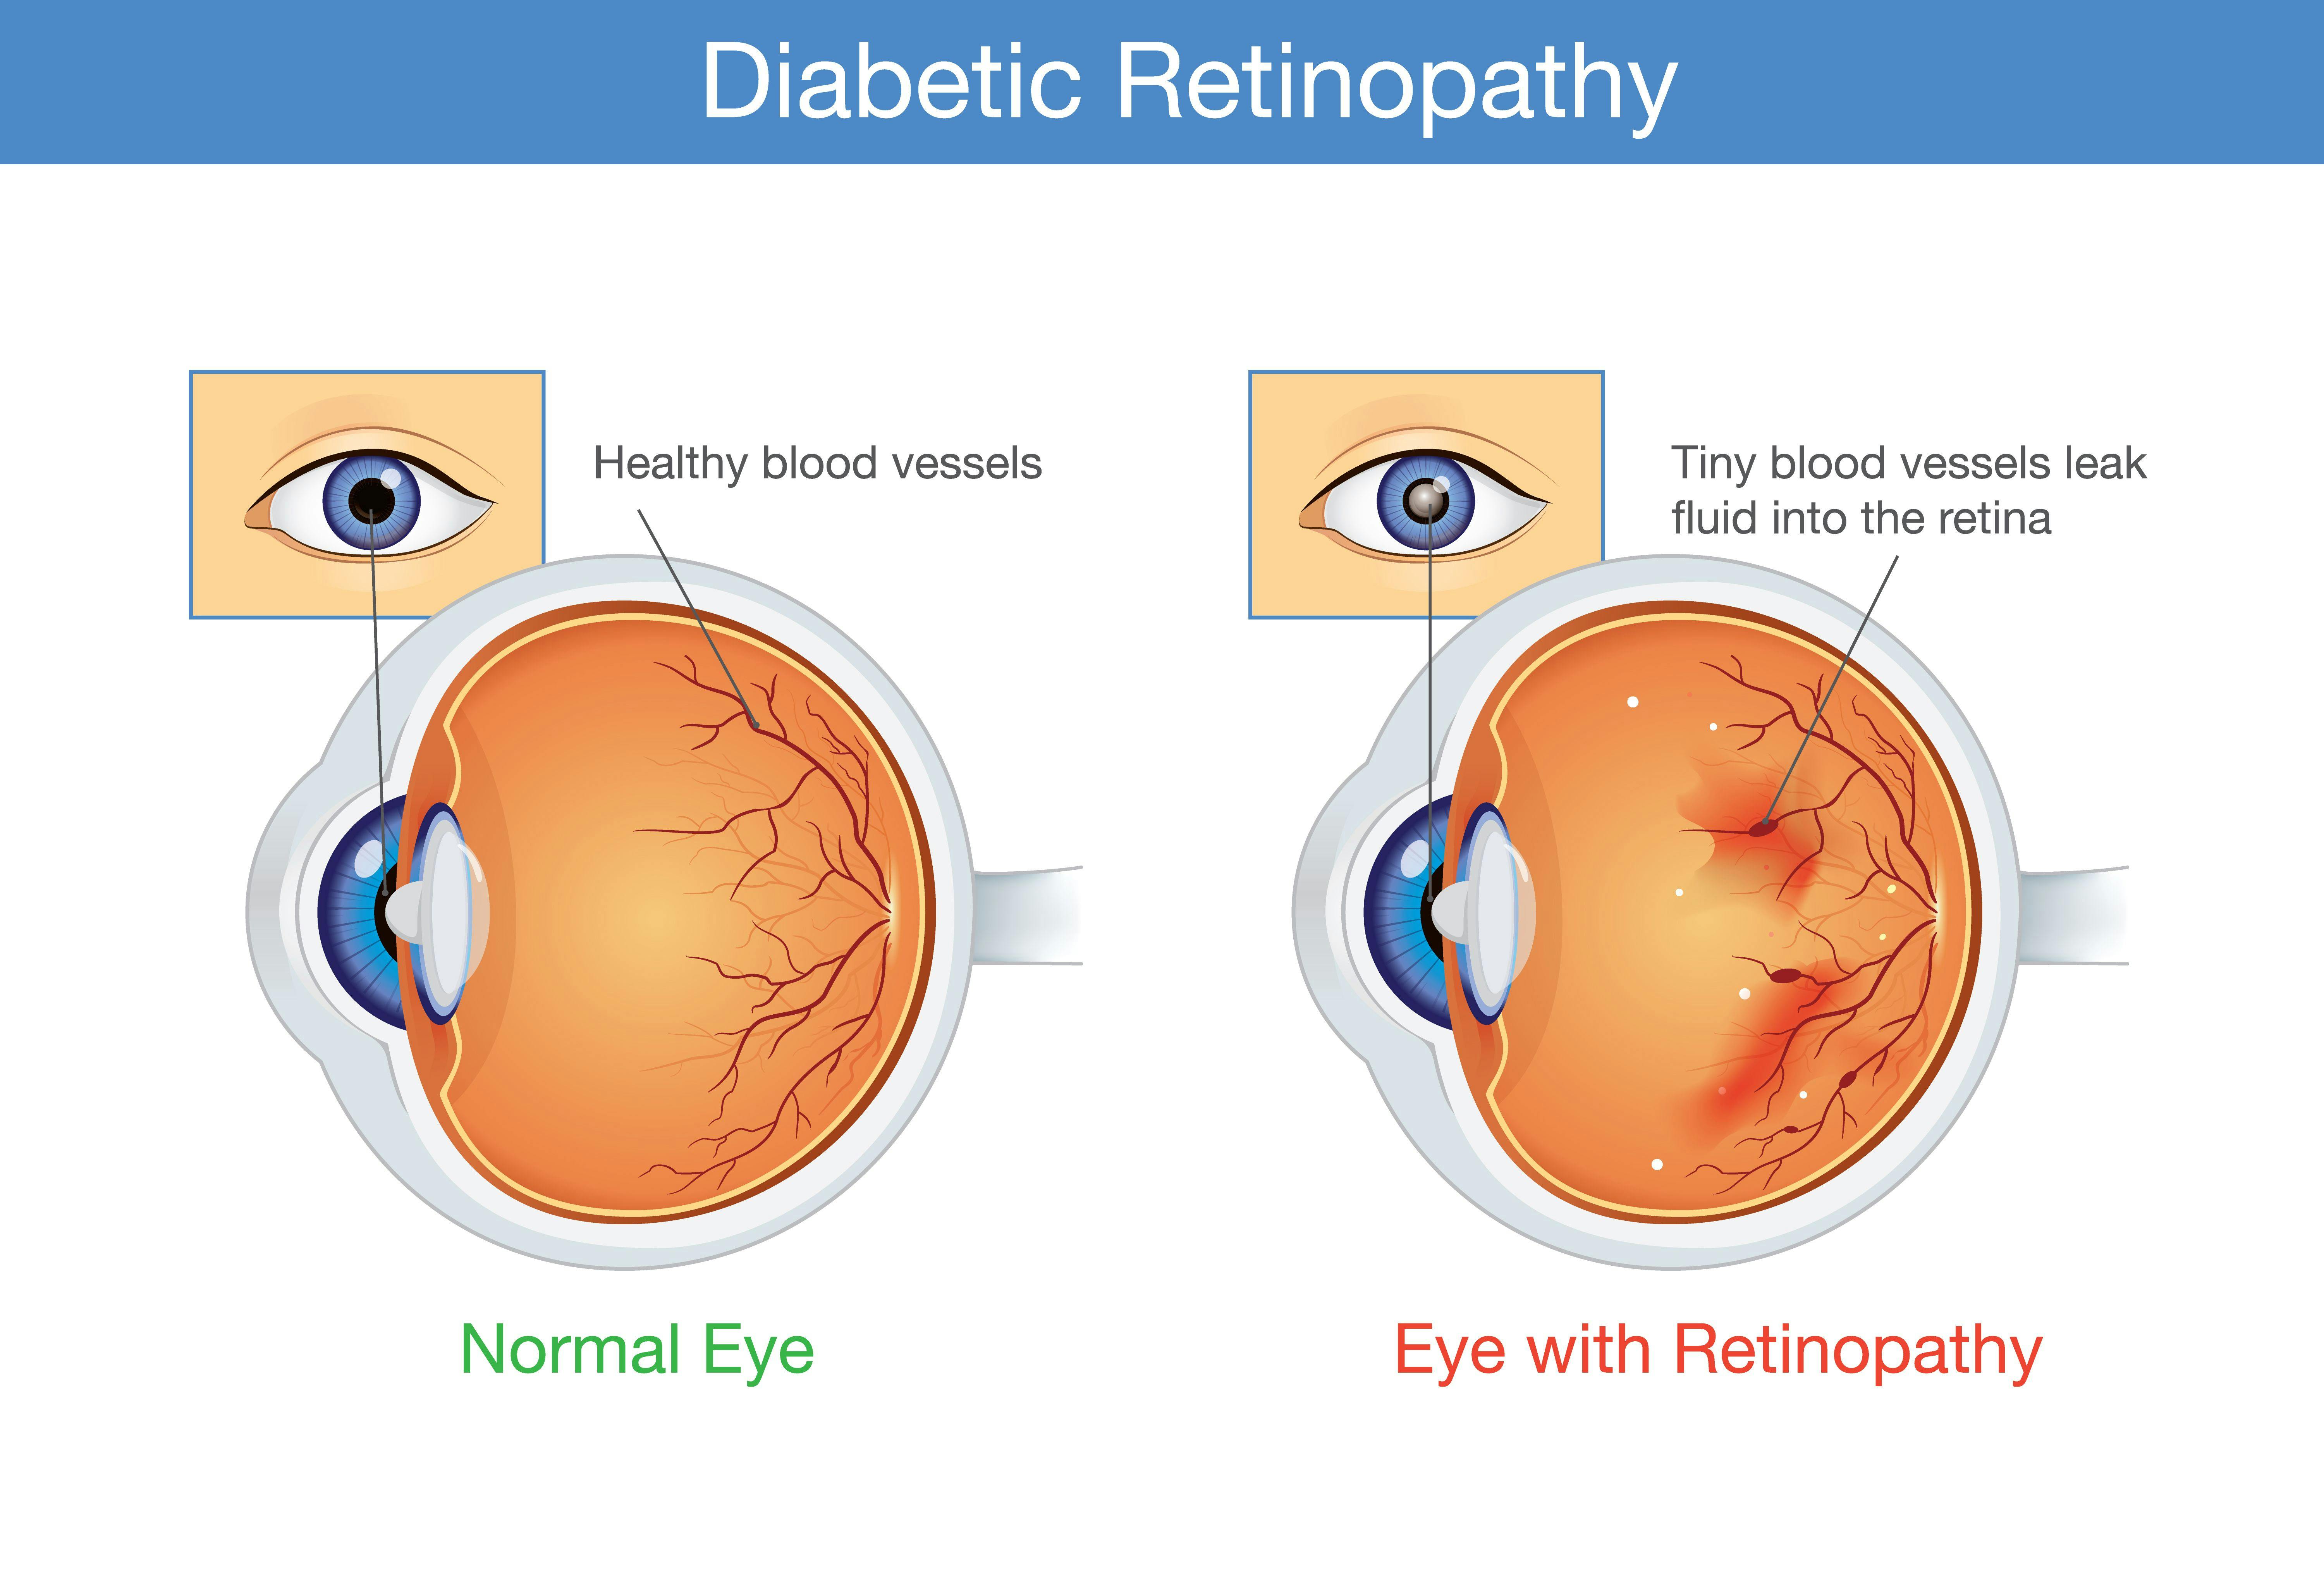
Diabetic Retinopathy
Diabetic retinopathy is a progressive eye disease caused by complications of diabetes. It affects the blood vessels in the retina, leading to vision impairment and if left untreated, blindness. The condition is characterized by symptoms such as blurred vision, floaters, and difficulty seeing at night. Regular eye exams and early detection are crucial for managing diabetic retinopathy effectively. Treatment options include laser therapy, medication injections, and surgery, aiming to preserve vision and prevent further damage to the retina.
Stages in diabetic retinopathy
Mild Nonproliferative Retinopathy: At this early stage, small areas of balloon-like swelling, known as microaneurysms, appear in the blood vessels of the retina.
Moderate Nonproliferative Retinopathy: As the disease progresses, the blood vessels that nourish the retina can become blocked. This stage may involve the development of cotton-wool spots (nerve fiber layer infarcts) and small hemorrhages.
Severe Nonproliferative Retinopathy: In this stage, a significant number of blood vessels become blocked, causing a substantial reduction in blood flow to the retina. This leads to the growth of new blood vessels.
Proliferative Retinopathy: This advanced stage is characterized by the growth of fragile new blood vessels on the surface of the retina and into the vitreous gel, which can cause severe vision problems and complications such as retinal detachment and glaucoma.

Challenges in manual diagnosis and database visualization in diabetic retinopathy (DR)
Subjectivity and Variability in manual interpretation affecting treatment decisions and Outcomes.
The limited availability of specialists leads to delayed diagnoses and suboptimal management.
Time-consuming manual analysis causes delays in timely diagnoses and interventions.
Lack of standardized protocols resulting in variations in assessment and reporting.
Scalability issues with handling large volumes of scans and managing patient records efficiently.
Our AI-based medical imaging system overcomes challenges in DR diagnosis
Objective Results: AI algorithms provide standardized assessments, reducing subjectivity and ensuring accurate diagnoses.
Enhanced Accessibility: The system is accessible remotely, improving access to expert-level diagnoses, especially in underserved areas.
Streamlined Processes: AI automates analysis, reducing diagnosis time and enabling timely interventions.
Automated Reporting: AI generates comprehensive reports.
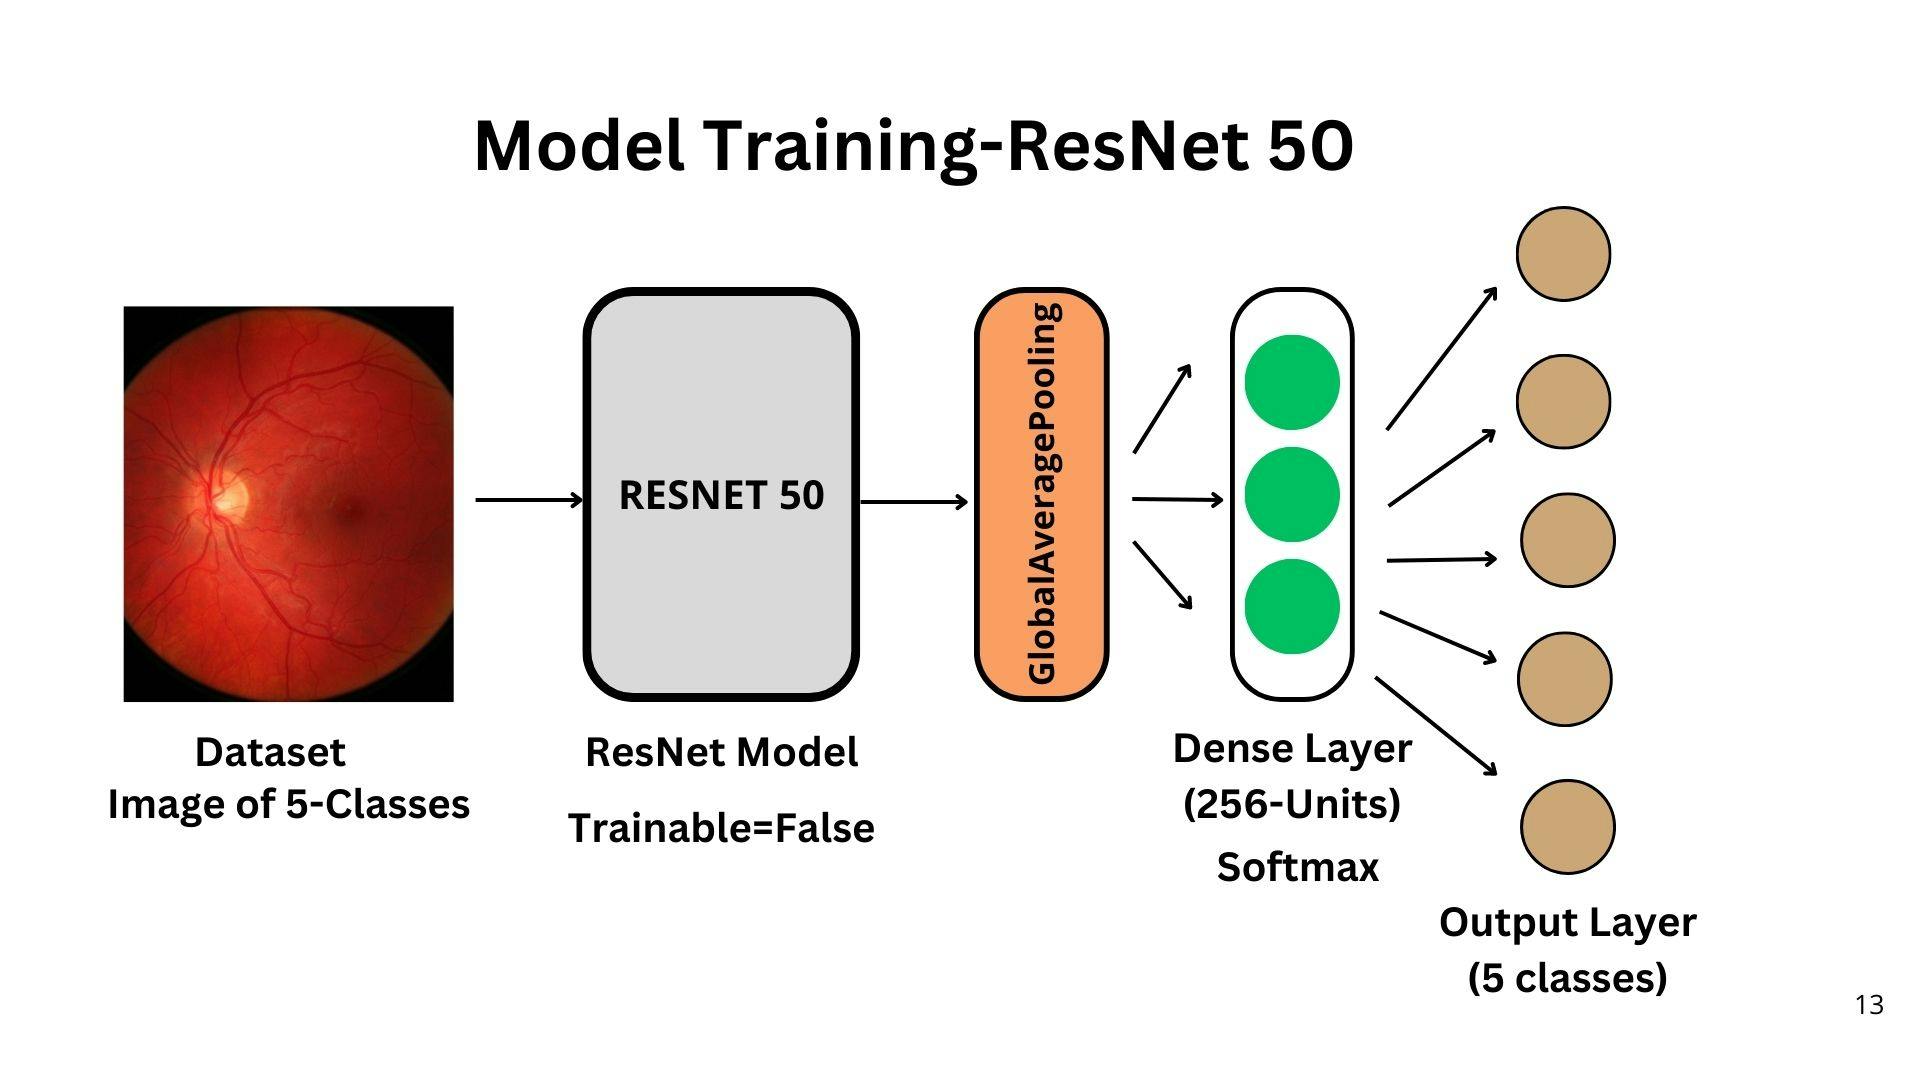
Building an Effective Diabetic Retinopathy Prediction Model using ResNet
Input Layer: The input layer expects images of size 224x224 pixels with 3 channels (RGB).
ResNet50 Base Model: The base model is ResNet50, a deep convolutional neural network with 50 layers. It has been pre-trained on the large-scale ImageNet dataset, which enables it to extract meaningful features from images.
Global Average Pooling Layer: The output of the base model is passed through a global average pooling layer. This layer reduces the spatial dimensions of the features to a fixed size, resulting in a 1D feature vector for each image.
Dense Layer: A dense layer with 256 units and ReLU activation is added on top of the global average pooling layer. This layer introduces non-linearity and enables the model to learn more complex representations.
Final Dense Layer: The last layer is a dense layer with the number of units equal to the number of classes (5 in this case). It uses the softmax activation function, which produces class probabilities for each input image. The model predicts the class with the highest probability as the final prediction.
CODE
Implementation of model training in Google Colab
Mount to google drive
 from google.colab import drive
 drive.mount('/content/drive')
Importing libraries
 import tensorflow as tf
 import tensorflow_datasets as tfds
 from tensorflow.keras.applications import ResNet50
 from tensorflow.keras.layers import Dense, GlobalAveragePooling2D
 from tensorflow.keras.models import Model
Loading the data training and testing data
 #loading data(paste your file location)
 data_path=pathlib.Path('your path')
 #declaring batchsize,width and height of image in dataset
 batch_size = 32
 img_height = 224
 img_width = 224
 #training data
 train_ds = tf.keras.utils.image_dataset_from_directory(
   data_path,
   validation_split=0.2,
   subset="training",
   seed=123,
   image_size=(img_height, img_width),
   batch_size=batch_size)
 #testing data
 val_ds = tf.keras.utils.image_dataset_from_directory(
   data_path,
   validation_split=0.2,
   subset="validation",
   seed=123,
   image_size=(img_height, img_width),
   batch_size=batch_size)
Total classes
 class_names = train_ds.class_names
 print(class_names)
Output
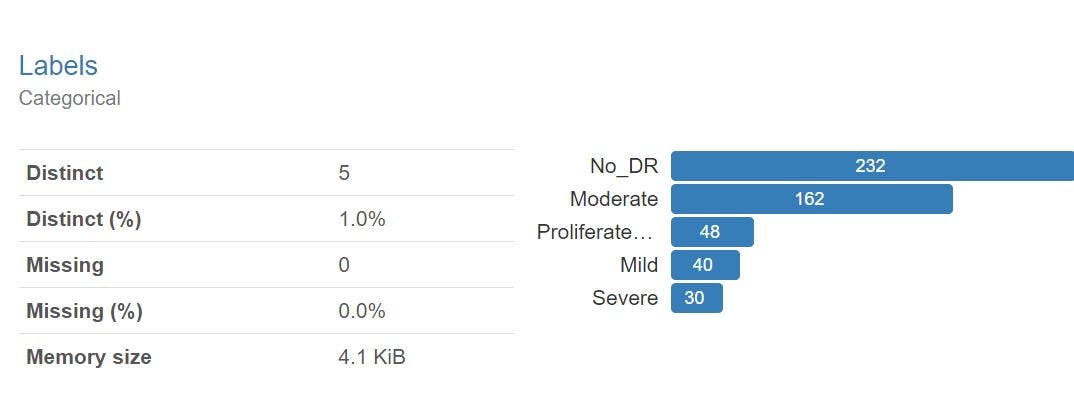
['Mild', 'Moderate', 'No_DR', 'Proliferate_DR', 'Severe']Normalizing the images in training data
 normalization_layer = tf.keras.layers.Rescaling(1./255)
 normalized_ds = train_ds.map(lambda x, y: (normalization_layer(x), y))
 image_batch, labels_batch = next(iter(normalized_ds))
 first_image = image_batch[0]
 # Notice the pixel values are now in `[0,1]`.
 print(np.min(first_image), np.max(first_image))
Building the Architecture(Transfer learning)
 log_dir = "logs/"

 # TensorBoard callback is used for visualizing the training process and model performance
 # log_dir specifies the directory where the logs and event files will be saved
 tensorboard_callback = TensorBoard(log_dir=log_dir, histogram_freq=1)

 '''To start the TensorBoard server and visualize the logs,
 you can run the following command in your terminal:
 tensorboard --logdir=logs/
 '''
 # Set the image size and number of classes
 IMG_SIZE = (224, 224)
 NUM_CLASSES = 5

 # Load the pre-trained ResNet model without the classification head
 base_model = ResNet50(weights='imagenet', include_top=False, input_shape=(IMG_SIZE[0], IMG_SIZE[1], 3))

 # Freeze the weights of the pre-trained layers
 for layer in base_model.layers:
     layer.trainable = False

 # Add a new classification head on top of the pre-trained model
 x = base_model.output
 x = GlobalAveragePooling2D()(x)
 x = Dense(256, activation='relu')(x)
 predictions = Dense(NUM_CLASSES, activation='softmax')(x)

 # Create the final model
 model = Model(inputs=base_model.input, outputs=predictions)

 # Compile the model
 model.compile(
   optimizer='adam',
   loss=tf.keras.losses.SparseCategoricalCrossentropy(from_logits=True),
   metrics=['accuracy'])
Training data to the model
 model.fit(
   train_ds,
   validation_data=val_ds,
   epochs=50,
   callbacks=[tensorboard_callback]
 )
Saving the model
model.save('best_model1.h5')
Evaluating the model with test data
from tensorflow.keras.models import load_model

# Load the saved model
model = load_model('best_model1.h5')

# Load and preprocess the test data

IMG_SIZE = (224, 224)
batch_size = 32

test_ds = tf.keras.utils.image_dataset_from_directory(
    data_path,
    image_size=IMG_SIZE,
    batch_size=batch_size
)

# Evaluate the model on the test data
test_loss, test_accuracy = model.evaluate(test_ds)
print(test_accuracy)
Finally, we got the Accuracy on testing data is about
0.9374658465385437
Building a responsive system using Streamlit
Developed an AI model to analyze eye scans for diabetic retinopathy
Categories severity into five levels: no DR, mild, moderate, severe, and proliferative
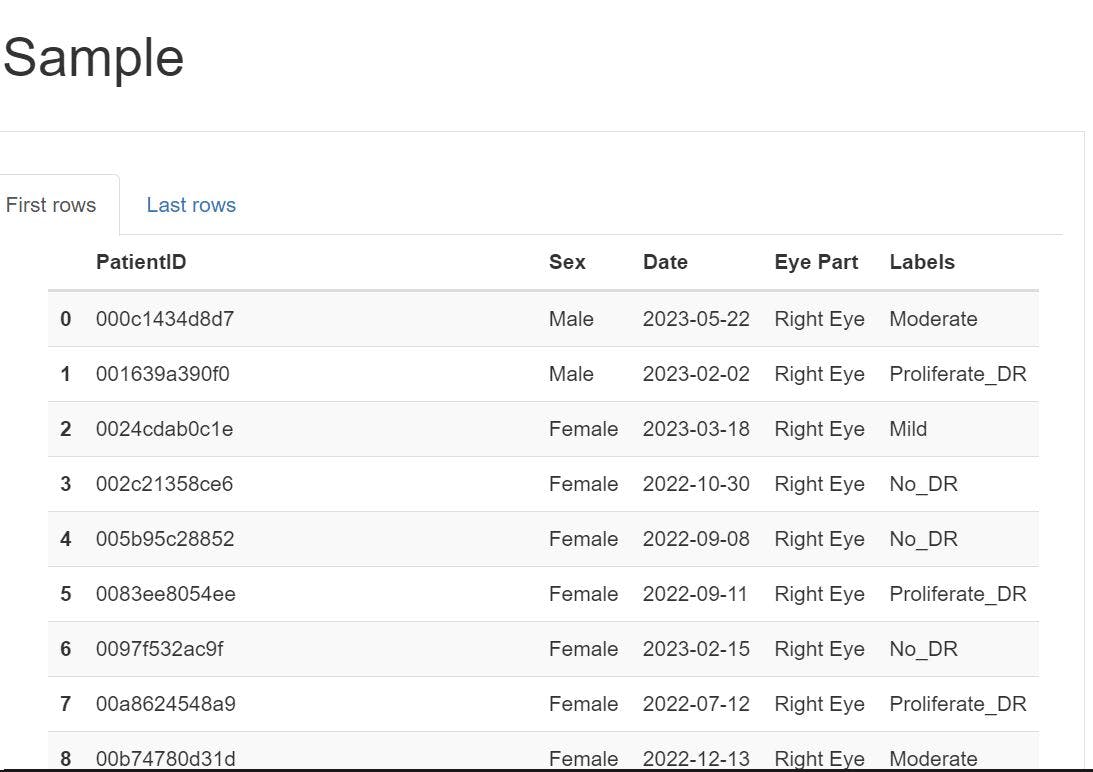
Provides summary reports (DB Visualisation) of patient retinal image scans in the database
The patient report includes ID, sex, examination date, and scan result
Future plans include implementing email and SMS notifications for severe cases

File 1: app.py
Streamlit application that includes different functionalities for a Diabetic Retinopathy Report Tool.
EXPLANATION:
Predict: Allows users to provide necessary information such as ID, sex, age, date, and eye part. Users can also upload an image. When the "Predict" button is pressed, it calls the
get_result_for_single_imagefunction fromrecognise.pyto predict the retinopathy level for the uploaded image. It then generates a report using thegenerateReportfunction fromget_report.pyand displays the report in the Streamlit app.Create Download Link: Defines a function
create_download_linkthat creates a download link for the generated report in PDF format.Render Report: Defines a function
render_reportthat creates a PDF report using the FPDF library. It adds an image, patient information, and other details to the PDF. The report is displayed in the Streamlit app, and a download link for the PDF is provided.Report: Allows users to select a patient ID and generate a report for that specific patient using the
generateReportfunction. The report is displayed and can be downloaded.Home: Placeholder function.
Dashboard: Allows users to run batch inference on the data stored in the
out_csv.csvfile. It reads the data, generates a data visualization report using pandas_profiling, and displays the report in the Streamlit app.Main: Sets up the Streamlit app, defines the layout, and calls the corresponding functions based on the selected option from the sidebar.
CODE
import streamlit as st # for building the web application
import PIL # for image processing tasks
import PIL.Image # for working with images
from datetime import date # for working with dates
import os # for interacting with the operating system
import base64 # for encoding and decoding binary data
import pandas_profiling # for generating data visualizations and summaries
import streamlit.components.v1 as components # for rendering HTML components
import pandas as pd # for data manipulation and analysis
from fpdf import FPDF # for creating PDF files
# create the files
# here we created get_report.py it is importing this and accesing the function
from get_report import generateReport
# here we created recognise.py it is importing this
from recognise import get_result_for_single_image, get_result, append_to_patient_record_csv
df = pd.read_csv('out_csv.csv') # Replace with your file path
# Extract the 'PatientID' column values and convert them to a list
patient_id = list(df['PatientID'])
def predict():
st.title("Diabetic Retinopathy Report Tool")
st.write("Please provide the necessary information and upload an image.")
# Add user input fields
id = st.text_input("ID") # Create a text input field for ID
sex = st.selectbox("Sex", ["Male", "Female"]) # Create a dropdown selectbox for sex
age = st.slider("Age", 1, 100) # Create a slider for age
selected_date = st.date_input("Select a date", date.today()) # Create a date input field
eye_part = st.selectbox("Eye Part", ['Left Eye', 'Right Eye']) # Create a dropdown selectbox for eye part
# Add image upload option
uploaded_image = st.file_uploader("Upload an image",
type=["jpg", "jpeg", "png"]) # Create a file uploader for images
# Check if an image has been uploaded
if uploaded_image is not None:
# Read the uploaded image
image = PIL.Image.open(uploaded_image)
st.image(image, caption="Uploaded Image", use_column_width=True)
# Generate a random filename
filename = id + ".png"
# Save the image to the "image Database" directory
image.save(os.path.join("image Database", filename))
st.write("Image saved successfully.")
# Call the append_to_patient_record_csv function
append_to_patient_record_csv(id, sex, selected_date, eye_part)
# if predict button is pressed
if st.button("Predict"):
get_result_for_single_image(id) # redirects to recognise.py
response = generateReport(id) # # redirects to get_report.py
render_report(response) # Call the render_report function in this file
def create_download_link(val, filename):
b64 = base64.b64encode(val) # Encode the value in base64 format
return f'<a href="data:application/octet-stream;base64,{b64.decode()}" download="{filename}.pdf">Download Report</a>'
def render_report(rep_data):
# Create an instance of the FPDF class
pdf = FPDF()
# Add a new page to the PDF document
pdf.add_page()
# Set the font to Arial, bold, size 16
pdf.set_font('Arial', 'B', 16)
pdf.multi_cell(300, 20, ' AI generated Diabetes Retinopathy Report', 0, 3)
pdf.line(0, 30, pdf.w, 30) # Draw a line at the specified coordinates
# Remove the 'image' key from the dictionary and assign its value to rep_image
rep_image = rep_data.pop('image')
# Add the image to the PDF at the specified coordinates
pdf.image(rep_image, 150, 40, 50, type='png')
# Iterate over the remaining key-value pairs in rep_data
for key, value in rep_data.items():
text = key + ' : ' + value # Create a text string with the key-value pair
pdf.set_font('Arial', '', 12) # Set the font to Arial, size 12
pdf.multi_cell(300, 15, text, 0, 1) # Add the text to the PDF
# Convert the PDF output to base64 format
base64_pdf = base64.b64encode(pdf.output(dest="S").encode("latin-1")).decode('utf-8')
pdf_display = f'<embed src="data:application/pdf;base64,{base64_pdf}" width="700" height="1000" type="application/pdf">'
# Display the PDF in Streamlit
st.markdown(pdf_display, unsafe_allow_html=True)
# Create a download link for the PDF
html = create_download_link(pdf.output(dest="S").encode("latin-1"), "Report")
# Display the download link in Streamlit
st.markdown(html, unsafe_allow_html=True)
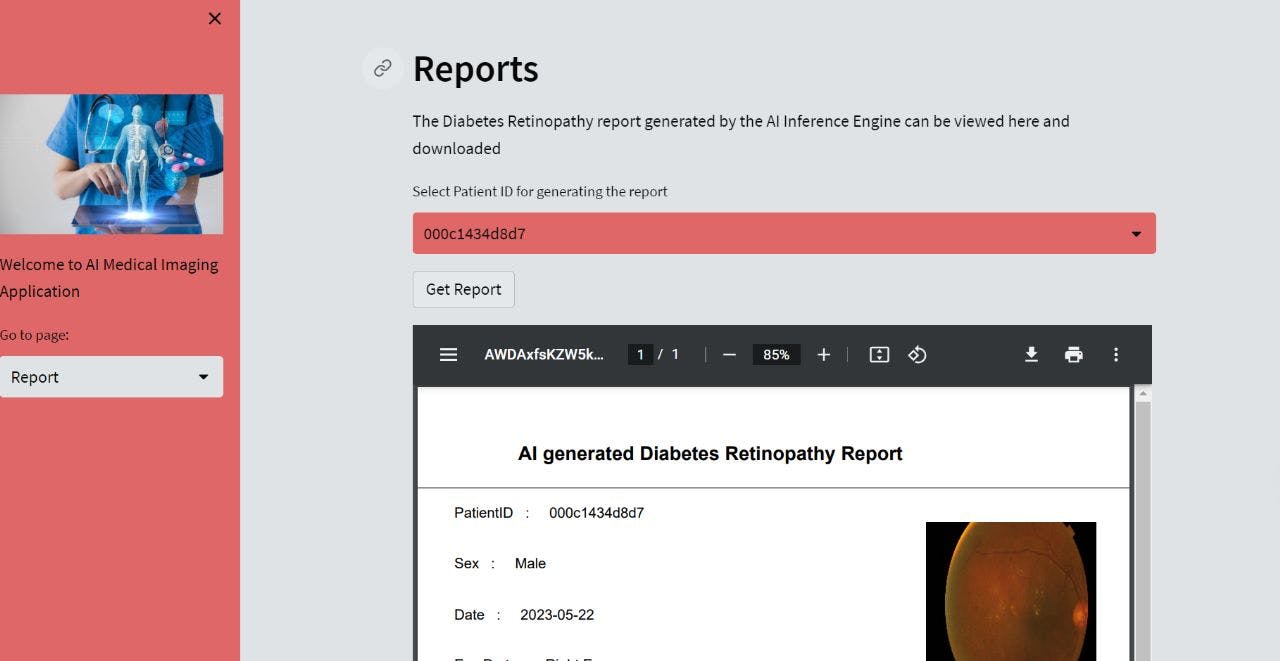
def report():
st.header('Reports')
st.write('The Diabetes Retinopathy report generated by the AI Inference Engine can be viewed here and downloaded')
rep_patientId = st.selectbox('Select Patient ID for generating the report', patient_id)
if st.button('Get Report'):
report = generateReport(rep_patientId) # redirects to get_report.py
render_report(report) # Call the render_report function
def home():
#optional display what you wish to place in home page
st.write("Service providing simplified retinopathy diagnosis by enabling easy scan uploads and providing AI-generated predictions.")
st.write("AI-based solution ensures high diagnostic accuracy, delivering precise and objective results for retinopathy diagnosis.")
st.write("AI-based solution streamlines the diagnostic process, saving time and improving efficiency.")
st.write("AI Model is featured with Automated tasks which enable scalability, allowing for the processing of a large number of scans.")
def dashboard():
st.title('Get Data Summary of all Images in Database')
st.write('Generating a Batch summary and getting results of all images in the database')
runbatch = st.button("Run batch inference")
if runbatch:
data = pd.read_csv('out_csv.csv') # Replace with your own file path
# Generate pandas profiling report
report = pandas_profiling.ProfileReport(data, title='Data Visualisation Report')
# Display the report in Streamlit
st.title('Data Summary')
components.html(report.to_html(), height=1000, width=800, scrolling=True)
def main():
st.sidebar.image('template/nav.png') # Display an image in the sidebar
st.sidebar.write('Welcome to AI Medical Imaging Application') # Write a text in the sidebar
opt = st.sidebar.selectbox("Go to page:", ['Home', 'Prediction', 'Report',
'Dashboard']) # Create a dropdown selectbox for page selection
st.image('template/main.png') # Display an image in the main area
st.title('AI Medical Imaging Application') # Write a title in the main area
if opt == 'Home':
home() # Call the home function
if opt == 'Prediction':
predict() # Call the predict function
if opt == 'Report':
report() # Call the report function
if opt == 'Dashboard':
dashboard() # Call the dashboard function
if __name__ == "__main__":
main() # Call the main function
File 2: get_report.py
The code defines a function generateReport that generates a report for a given patient ID using data from a CSV file (out_csv.csv).
EXPLANATION:
It reads the CSV file into a pandas DataFrame (
df) usingpd.read_csv.The function expects a patient ID (
patID) as input.It defines a list of report fields (
report_fields) that specify the columns to be included in the report.If the DataFrame is not empty (
len(df) > 0), the function proceeds to extract the rows from the DataFrame where the 'PatientID' column matches the given patient ID (exam = df.loc[df['PatientID'] == patID]).It selects the first row from the selected rows (
report_data = exam.iloc[0]).It creates an empty dictionary (
report_dict) to store the report data.It iterates over the report fields and adds each field and its corresponding value from the selected row to the dictionary.
It creates a
Pathobject (image_path) for the image associated with the patient ID.It adds the image path to the dictionary with the key 'image'.
Finally, it returns the report dictionary.
import pandas as pd  # Import the pandas library
import pathlib  # Import the pathlib module


def generateReport(patID):
    df = pd.read_csv('out_csv.csv', names=['PatientID', 'Sex', 'Date', 'Eye Part', 'Labels'])  # Read the CSV file into a pandas DataFrame

    report_fields = ["PatientID", "Sex", "Date", "Eye Part", "Labels"]  # Define a list of report fields
    if len(df):  # Check if the DataFrame is not empty
        exam = df.loc[df['PatientID'] == patID]  # Select rows from the DataFrame where the 'PatientID' column matches the given patient ID

        report_data = exam.iloc[0]  # Get the first row of the selected rows

        report_dict = {}  # Create an empty dictionary to store the report data
        for field in range(0, len(report_fields)):
            # Add the report field and its corresponding value to the dictionary
            report_dict[report_fields[field]] = str(report_data[field])
        image_path = pathlib.Path(f"image Database/{patID}.png")  # Create a Path object for the image path
        report_dict['image'] = str(image_path)  # Add the image path to the dictionary with the key 'image'

        return report_dict  # Return the report dictionary
File 3: recognise.py
The code includes two additional functions for processing images and making predictions using a trained model.
EXPLANATION:
The code includes a
preprocess_imagefunction that takes an image path as input, loads and resizes the image to the desired dimensions, and converts it into a numpy array.There is a
get_result_for_single_imagefunction that loads a trained model, preprocesses the image associated with a given patient ID and makes a prediction using the model. It retrieves the predicted class, maps it to a label, and appends the predicted label to the corresponding patient record in a data frame.The code reads the patient record CSV file into a pandas DataFrame and defines the class labels for prediction results.
The
get_result_for_single_imagefunction appends the predicted label to the patient record and writes the updated record to an output CSV file.The main part of the code is a Streamlit application that allows users to input information, upload an image, trigger predictions, generate reports, and view data summaries.
import csv
from tensorflow.keras.models import load_model
import pandas as pd
import pathlib
import numpy as np
from tensorflow.keras.preprocessing import image

# these we done in training phase
img_height = 224  # Set the desired height of the image
img_width = 224  # Set the desired width of the image
batch_size = 32  # Set the batch size for processing images

df = pd.read_csv('patient_record.csv')  # Read the patient record CSV file into a pandas DataFrame


def append_to_patient_record_csv(id, sex, selected_date, eye_part):
    # Append the provided information as a new row to the patient record CSV file
    with open("patient_record.csv", "a", newline="") as csvfile:
        writer = csv.writer(csvfile)
        writer.writerow([id, sex, selected_date, eye_part])


def preprocess_image(image_path):
    # Preprocess the image by loading and resizing it
    img = image.load_img(image_path, target_size=(img_height, img_width))
    img = image.img_to_array(img)
    return img

def get_result_for_single_image(patientid):
    model = load_model('best_model.h5')  # Load the saved model
    # Initialize an empty list to store the predicted labels
    predicted_labels = []
    # Create a Path object for the image path
    image_path = pathlib.Path(f"image Database/{patientid}.png")
    # Preprocess the image
    preprocessed_image = preprocess_image(str(image_path))
    # Make a prediction using the model
    prediction = model.predict(np.expand_dims(preprocessed_image, axis=0))
    # Get the predicted class
    predicted_class = np.argmax(prediction, axis=1)
    # Define the class labels
    class_labels = ['Mild', 'Moderate', 'No_DR', 'Proliferate_DR', 'Severe']
    predicted_label = class_labels[predicted_class[0]]  # Get the predicted label

    df = pd.read_csv('patient_record.csv')  # Read the patient record CSV file into a pandas DataFrame
    row_list = list(
        df.loc[df['PatientID'] == patientid].iloc[0])  # Get the row from the DataFrame for the given patient ID

    row_list.append(predicted_label)  # Append the predicted label to the row list


    with open("out_csv.csv", "a", newline="") as csvfile:
        writer = csv.writer(csvfile)
        writer.writerow(row_list)  # Write the row list as a new row to the output CSV file
RUNNING THE APPLICATION
To run the Streamlit application, make sure you have Streamlit installed. Then, execute the following command in the terminal:
streamlit run app.py
This will start the Streamlit server, and you can access the application in your web browser.
Diabetic Retinopathy Application Result Images
RESULT 1: PREDICTION MODULE

RESULT 2: REPORT MODULE
RESULT 3: DASHBOARD MODULE


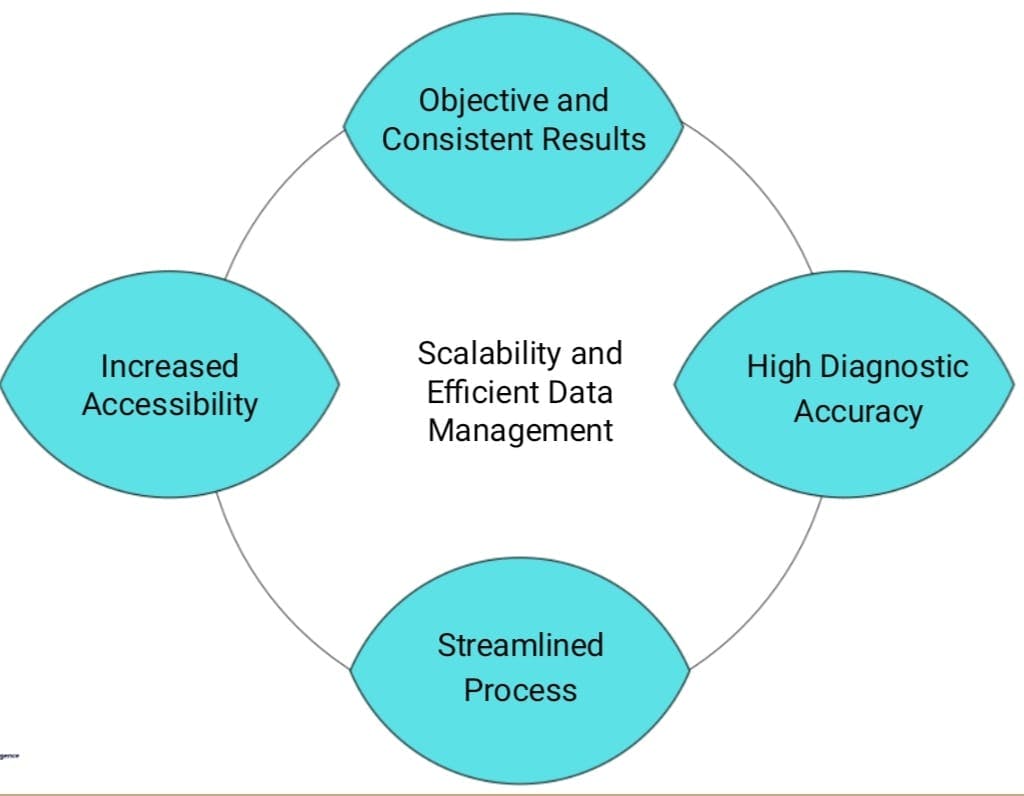
UNIQUENESS OF OUR APPLICATION
High Diagnostic Accuracy: Our model utilizes advanced machine learning algorithms to achieve high diagnostic accuracy in detecting and categorizing diabetic retinopathy.
Rigorous Training and Fine-tuning: The model has undergone extensive training and fine-tuning processes to ensure consistent and reliable outcomes.
Increased Accessibility: Our application aims to address the limited availability of doctors in remote areas by providing accessible and automated diagnostic capabilities.
Streamlined Diagnostic Process: By leveraging our model, clinicians can streamline the diagnostic process, allowing them to focus on critical decision-making rather than manual analysis.
Efficient Resource Utilization: Our model employs efficient data storage and processing techniques, optimizing resources and enabling timely analysis of retinal images.
CONCLUSION
Our AI-based solution is a game-changer in retinopathy diagnosis, offering not only high diagnostic accuracy but also providing objective results. The web application we have developed simplifies the entire process by allowing users to effortlessly upload their eye scans, receive AI-generated predictions, and obtain comprehensive reports.
In summary, our AI-based solution brings together cutting-edge technology, a user-friendly interface, automation, and improved accessibility to revolutionize retinopathy diagnosis, ultimately leading to better patient outcomes.
Thank You!!!
By Techiee hackers